By Johann Robette, Supply Chain Expert @ Vekia

How to measure performance ?
Most important decisions in companies are based on some form of forecasting: decisions to hire, to develop a new product line, to expand into new territory, etc.
Therefore forecasting plays an important role in the day-to-day running of our supply chains.
THE ROLE OF THE FORECASTER IN THE ORGANISATION
Interestingly, the need to predict is so critical and requires such expertise that it has led to the creation of a dedicated profession: forecaster.
From an organisational perspective, companies have created and then specialized this expertise around dedicated functions, dedicated teams, and sometimes even entire dedicated departments.
Most of the time, these structures are supervised by Supply Chain departments.
Such organisation of the forecasting function in companies have numerous merits, in particular, to bring together the experts in this subject in teams where they can share their practices.
However, this separation of missions poses a key problem. By separating the “forecasting” function from the “decision-making” function, many companies have, in a way, created silos that lead to sub-optimal performance.
THE CONTRIBUTION OF FORECASTING TO BUSINESS PERFORMANCE IS COMPLEX TO MEASURE
And here’s why: although the forecast plays a key role in the decision-making process, it’s not the only one.
Other elements also have to be considered, often in the form of constraints and other business rules.
As a result, it is often complex to measure precisely the contribution of the forecast to the final outcome, i.e. the performance of the decision taken.
For example, when deciding to purchase goods from a supplier, the demand forecast is obviously really important, but so does the allowed pack-sizes, the minimum order quantity, the storage finite capacity, etc.
Everyone is aware of the high value of forecasting, but its real business impact is often difficult – if not impossible – to measure.
THE CHALLENGE IS TO FOCUS ON THE RIGHT FORECAST METRICS
Of course, all forecasters regularly evaluate the reliability of their forecasts, and many formulas exist for this purpose. These metrics focus on the intrinsic quality of the forecast produced and are generally called “Forecast Accuracy” metrics.
Doing so, they often leave out the analysis of final forecast-based decisions and their relevance to the business.
At Vekia, we’ve been making this observation for quite some time. And for sure, we are not the first nor the last ones to identify this important limit.
As we love taking up challenges, we naturally asked ourselves: how can we evaluate the quality of a forecast so that the decisions it leads to are the best ones? In other words, what makes a good forecast ?
What makes a good forecast ?
To understand what a good forecast is, it is necessary to go back to the purpose of forecasting.
In a recent talk at Lancaster’s CMAF (Centre for Marketing Analytics and Forecasting), Paul Goodwin reminded us that forecasts are not an end but “are done to support decision-makers so they can make better decisions”.
FUNDAMENTALS OF FORECASTING
Let us briefly recall the state of the art and the fundamentals of forecasting.
The following definition of what an ideal forecast is is widely shared. An ideal forecast is a perfectly true prediction.
For example: “If 996 units sold were forecasted and, at the end of the day, 996 units were effectively sold, then this forecast was perfect!”
However, it is obvious that despite all efforts, the future is never known with such certainty. Therefore, to measure the quality of a forecast, the practice is to measure its error. For example: “If 996 units sold were forecasted and, at the end of the day, only 900 units were effectively sold, then this forecast made an error of 96 units”
The main mission of forecasters is to generate forecasts that minimise this error. This error measurement is made possible by a dozen different “Forecast Accuracy” metrics to which are added countless variants developed by companies for their specific needs.
THE BEST FORECAST IS THE ONE THAT ALLOWS YOU TO MAKE THE BEST DECISIONS
Unfortunately, this approach, reinforced by decades of practice, leaves out an essential point: the purpose of forecasting is not and has never been to provide the best forecast ever! Its purpose is to provide the best forecast for a given specific use.
The best forecast is therefore not the perfect one, but the one that allows the best decisions to be taken. The mission of forecasters should therefore not be to minimise the error between a forecast and the reality but to minimise the decisions errors.
Here’s an example. Let’s imagine a very simple decision process, taken from everyday life: every evening, a woman consults the weather forecast to decide whether or not to take her umbrella the next day.
If we focus on the forecast error, then when the forecast does not predict rain and indeed it does not rain the next day, the forecast was perfect. But, on the other hand, if the forecast calls for 10mm of rain and it turns out to be ten times more, then the forecast was wrong with a significant error.
What is being measured here is the intrinsic forecast error.
But let’s focus now on the decision made. In the specific context of the “to umbrella or not to umbrella” decision, the above error wouldn’t have had any impact on the decision taken. In both cases, the woman would have made the right choice and taken her umbrella. In terms of its use, the forecast was therefore perfect.
Thus, the quality of a forecast totally depends on its use and the decisions it trigger.
Yet, as we have seen, forecasters only have metrics that measure the intrinsic accuracy of the forecast. None of them takes into account its actual use.
This does not mean that these metrics are of no interest, far from it. But we must recognise that they are not the most appropriate ones from a business perspective…
Towards a new generation of “decision impact” metrics
Fortunately, it is quite possible to approach the quality of a forecast differently. To do so, a new generation of metrics must be introduced. Those metrics are called “Decision Impact” (and noted “DI”) and no longer focus on intrinsic error but rather on the quality of the decisions made.
BUILDING A DIGITAL TWIN
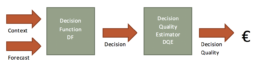
The proposed metrics requires the creation of a computer model (or “digital twin“) that can, for any forecast input, simulate the decision process and evaluate the quality of the final decision.

It is then necessary to model the decision process (through a Decision Function denoted “DF”) and to define a measure of the decision quality (via a Decision Quality Estimator denoted “DQE”).
The quality of a decision can be expressed in many ways. However, we highly recommend expressing it as a financial cost as this allows multiples use cases that will be discussed later on.
Of course, the perfect modelling of processes and impacts will sometimes be difficult, if not impossible, to achieve. But a simplified model often manages to effectively “approximate” much more complex realities.
LEVERAGING 3 TYPES OF FORECASTS
Three different forecasts are needed to generate the proposed new metrics and to demonstrate their value:
· The so-called “actual” forecast, resulting from the forecasting process in place.
· The so-called “naïve” forecast, resulting from the simplest forecasting method that would naturally be used if the forecasting function did not exist in the company.
· The so-called “oracle” forecast, i.e. the ground truth, measured a posteriori and corresponding to the observations themselves.
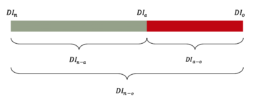
These 3 types of forecasts are then consumed by the Digital Twin to simulate the related decisions and their respective quality referred to as a “Decision Impact”.
· The cost of the decisions enabled by the actual forecast is denoted “DIa”, ie. Decision Impact of index “a” for “actual”. It measures the quality of the decision that the current forecasting process generates.
· The cost of the decisions enabled by the naïve forecast is denoted “DIn”, ie. Decision Impact of index “n” for “naïve”. It measures the quality of the decision that the simplest forecasting process would generate.
· The cost of the decisions enabled by the oracle forecast is denoted “DIo”, ie. Decision Impact of index “o” for “oracle”. It measures the quality of the decision that perfect knowledge of the future would generate.
DIa, DIn and DIo deliver valuable data about the forecasting context. But more than that, they’re the fundamental building blocks that could then be assembled to generate three insightful metrics.
The first metric denoted “DIn-o” is the difference between “DIn” (cost of the “naive” forecast-based decision) and “DIo” (cost of the “oracle” forecast-based decisions). This metric defines the complete playing field, addressable through forecast improvement.
DIn-o= DIn – DIo
The second metric denoted “DIn-a” is the difference between “DIn” (cost of the “naive” forecast-based decisions) and “DIa” (cost of the “actual” forecast-based decisions). Therefore, it measures the added value delivered by the actual forecasting process.
This metric relates to the notion of FVA (Forecast Value Added) and enhances it by delivering a dollarized vision of the added value.
DIn-a = DIn – DIa
The last metric denoted “DIa-o” is the difference between “DIa” (cost of the “actual” forecast-based decisions) and “DIo” (cost of the “oracle” forecast-based decisions).
Therefore, it measures the maximum value that could still be delivered by improving the actual forecast process.
DIa-o = DIa – DIo
Combined, these metrics can be rendered, analysed and interpreted through easily graphical representations such as stacked bars/areas or gauges.
10 new exciting perspectives
This new bunch of “Decision Impact” metrics opens up completely new perspectives, as shown by the following use cases.
METRICS BENEFITING THE FORECASTERS
Forecasters are the very first to benefit from these metrics. Among other things, the new insights enable:
1) to have non-ambiguous “North Star” metrics that at last deliver a reliable view on the forecast quality. Indeed, it’s important to remind that traditional Forecast Accuracy metrics regularly contradict each other;
2) to select and configure correctly the forecasting models that best support the decision-making;
3) to generate a value map to clearly identify value pools;
4) to know precisely when to stop improving a forecast, as the yet-to-be-harvested added value does not worth it;
5) conversely, to know on which perimeter would benefit the most from an improved forecast;
6) to prioritize the most impactful sub-perimeter, if the yet-to-be-improved perimeter is too large given the available resources;
7) to evaluate a dollarized FVA for each contributor/step of the forecasting process.
METRICS BENEFITING THE WHOLE COMPANY
The benefits of these new metrics are not limited to the forecasters only. The new insights enable the whole company:
1) to streamline and smooth the communication between departments about forecasts thanks to metrics that are, at last, easily understandable for each stakeholder;
2) to evaluate and share the delivered value of the forecasting process (and of its subparts: per forecaster or per step) in a fair, non-contradictory and easy to understand way.
As these metrics are more than pure forecasting metrics, the same approach could be applied to measure the impact of changing input constraints instead of changing input forecasts.
For example, this allows the evaluation of the pack-size costs or the impact of the delivery frequencies… It’s then a great tool to point out desirable areas for improvement, etc.
Conclusion
Each and every company is engaged in a daily struggle against inefficiencies and wastes. Silos have long been pointed out as such, and are perceived as they truly are: fractures within organisations.
The forecasting function, on the other hand, naturally shouldn’t be such as a silo, as it has a central position within the company. It is indeed a key partner for many departments and is at the very heart of key business processes such as IBF and S&OP.
However, within the practices of forecasters, performance measurement remains historically and surprisingly uncorrelated with the uses and business impacts of the forecasts.
BRINGING BUSINESS BACK INTO FORECAST PRACTICES
The hereby introduced “Decision Impact” family of metrics makes it possible to bring back the “business” dimension into the very heart of planning. The benefit being the realignment of the entire company around the business.
More than that, these metrics open up new perspectives and allow for completely new use cases around automation, prioritisation and improvement of key business processes.
“DECISION IMPACT” IS AT THE HEART OF VEKIA’ STRATEGY
These “Decision Impact” metrics have been used for several months at Vekia in the numerous contexts of our customers (retail, maintenance, energy, telecommunications, pharmaceuticals, etc.).
This demonstrated a significant contribution to decisions improvement, as they were first used 1) to select the most appropriate forecast algorithms and 2) to fine-tune our probabilistic replenishment engine to maximize the generated value.
What about your company ? Do the applied metrics aim for “perfect accuracy” or “perfect decision”? What prospects do these new metrics open up for you?
In our next articles, we will go into more detail on the operational uses of “Decision Impact” metrics.
Learn more : Our last weekly blast on supply chain automation.