
The contributions of the probabilist in the Supply Chain

How does the Supply Chain make its forecasts ?
What will the weather be like tomorrow? How many people will go to see the latest James Cameron movie next week? What color will be in fashion next year?
These questions are difficult to answer with precision!
Why? Because the very nature of the future is to be uncertain. As a general rule, we cannot know with certainty what tomorrow will bring.
But this does not prevent us from making assumptions, taking hypotheses, making plans and organizing ourselves accordingly.
In the supply chain, the first objective is to ensure the availability of products, services or resources at the time we need them and in the quantities we need. As some deadlines are unavoidable, some decisions have to be made days, weeks or even months in advance.
This is why one of the core activities of SC is demand forecasting. The challenge is to estimate in advance and as accurately as possible what the future demand will be, and to make the right decisions!

How does it work? How does the Supply Chain make its forecasts?
For decades, they have relied a so-called “deterministic” approach to forecasting. A deterministic forecast is a single number considered as the most likely future. Although this view of the future is only an average assumption, it is this single figure that feeds the whole supply logic: stock sizing, calculation of needs and planning of production, transport, team sizing, etc. Everything is designed to meet this “single” vision of the future.
Sometimes, this forecast is accompanied by an error measure to materialise the uncertainty. But this measure is never used in the calculations.
What happens if the forecast does not come true?
In fact, it is extremely rare for a deterministic forecast to come true perfectly!
There is a 50% chance of being above and 50% of being below. Therefore, according to the importance of the error that we will have committed, we will have to face either a shortage or on the contrary an over-sizing.
Obviously, supply professionals are very aware of this major limitation and they have very quickly developed workarounds that allow them to “limit the damage”.
There are two cases.
When the actual demand is higher than the forecast, there is a shortage. The main tool in this case is the so-called safety stock. In a simplistic way, it is a question of keeping a certain amount of stock “just in case” it is needed.
Sized on the basis of a statistical analysis of demand and past delivery delays, these safety stocks are more or less regularly updated.
When demand is lower than forecasted, appropriate actions are taken a posteriori and whenever possible to dispose of the surplus.
It is interesting to note that, in the end, only the safety stock allows the uncertainty to be partially taken into account through an analysis of the variability of past demand and the reliability of past deliveries.
What are the limits of the deterministic approach?
The Achilles heel of the deterministic approach lies in its vision of a future that is then considered certain.
In fact, in a deterministic approach, whether the future demand is 500+/-10 or 500+/-500 or 500(+200/-100), the supply will remain strictly identical since it only considers the average demand and totally ignores the uncertainty that accompanies it.
The only way to take uncertainty into account is through the safety stock. However, this stock only considers past behavior, generally over a long period of time.
If the uncertainty evolves over time, it will not take it into account.
If by a better control of a process or thanks to more reliable information, a company was able to reduce the uncertainty of its future, it would not change anything to its supply policy.
If on the other hand, due to an X or Y evolution, the uncertainty of the future would increase, there again the supply policy would not change.
Another limitation is that the safety stock only considers the uncertainty of the demand and the respect of the delivery dates. However, many other data are also uncertain. For example, the quantity to be received, the quality of the upcoming delivery and even the current stock levels are more or less incorrect in practice, as evidenced by the inventory discrepancies that occur every year.
Fortunately, there is a new approach to overcome these limitations and allow for much more reliable decision-making.
What is a probabilistic approach?
Probability is the language par excellence for describing uncertain information perfectly.
Far from being limited to the “most probable future”, a probabilistic forecast is a forecast that describes all possible futures, and their chance of occurrence.
For example, instead of announcing that tomorrow’s temperature will be 20°, a probabilistic forecast states that there is a 0% chance that it will be 16° or colder, a 10% chance that it will be 17°, a 14% chance that it will be 18°, a 18% chance that it will be 19%, a 25% chance that it will be 20°, and so on, down to a 0% chance that it will be 25% or more.
Based on this principle, it is possible to perfectly describe the uncertainty associated with any information, such as a delivery date, a quantity to be received, a stock level, the price of certain resources (material, hr, transportation), etc.
Once we have this perfect description of the future and its uncertainty, it is possible to evaluate the different supply scenarios and to select the most suitable one: reducing the risk, guaranteeing a level of service and/or minimizing a cost.
It is understandable that, because it is based on an exhaustive analysis of possible scenarios and allows for all forms of uncertainty to be taken into account, the probabilistic approach allows for perfectly informed decision-making, whereas the deterministic approach only takes uncertainty into account in an imperfect and incomplete manner.

Moving from a deterministic to a probabilistic approach. Which path for which contributions?
A recent study conducted by Vekia (to be published soon) based on the M5 competition dataset shows that, for the same forecast, the switch from deterministic to probabilistic forecasting leads to a 53% reduction in average SC costs.
Moving from deterministic to probabilistic forecasting represents a profound transformation of practices, tools and processes related to forecast generation and consumption. It is now a matter of manipulating probabilities where previously we manipulated a probable future.
The 4th generation of APS, now available in a robust and scalable way, allows to erase its limits by proposing a module that is simple to implement and use and compatible with existing ERP systems.

Vekia & Julien Rollon , Project Manager at Mr Bricolage

I’m Julien Rollon, I’m in charge of Vekia’s deployment in Mr. Bricolage Group. I have a professional background that is mainly indistrual. I’ve done master’s degree in the domain industrial management with a specialization in ERPs and information systems.
I have spent twelve years in the industry in an international environment. I joined Mr. Bricolage in 2015, in order to deploy Vekia solution through machine learning.
Today Vekia solution is part of nearly 200 stores throughout France of size more or less large, from the type of store called “city” that is 800 square meters to the one called “specialist” that is bigger than 4500 square meters. Meaning that in terms of references, we can have from 16 000 references to 90 000 managed in stores.

Julien, concerning your career, you have had the opportunity to develop ERPs and solutions for more than 20 years, and you have probably seen the evolutions. What is your feeling concerning these solutions that have been set up for the retail even for other organization, I know that you’ve worked in the sector of the industry, what is you feeling on the evolution of Supply Chain ERPs?
It is fully radical, I have settled into Oracle Business Suite, into SAP, into SEDGE for the calculation of needs, of the production, we were still on an archaic system where there were sales and forecast analysis that used to be done manually or through Excel files that we had to pilot.
Machine Learning, AI compose this powerful data analysis made in a short amount of time, in particular during night time when everyone “rest”, it is an impressive gain in terms of data and of results and performance. For my part, coming from the industry and knowing the old systems, I was like most of the people, a little bit dubious concerning this way to work. But in reality, for me to be credible towards stores and to see that the result is real, I have to visually expose these results at the level of stores and realize that the reliability rate is beyond 90%.
For instance, if we take a key product at Mr. Bricolage such as the white spirit, Vekia’s software tell us that in 3 weeks we will sell 100 of it, at the end of these 3 weeks we sold 90 of the 100. Nowadays, having a tool this effective in terms of reliability and forecast is a big added value and it is comforting for stores.
Even when the economic activity is not meeting the expectation, we have defined standard management rules with a couple of adherents. Nowadays, by deploying the solution in a standard way I win around 10 and 20 days of stock lifetime per year.
Therefore, there are some stores that win a little bit less stock lifetime, maybe because they are less constant and maybe fearful concerning the configuration and the confidence in the tool. But some other can win tens of coverage days per year.
If we remember a little bit how it was working a few years ago with the use of Excel for the forecast. It is clear that there is a human limit, we cannot ask people or adherents to mainly spend their time to manage some Excel or forecast when we see the amount of data that has to be calculated for the machine learning it makes sense.
If we talk about the adherents, the problematic of the information system of infrastructure management is that they don’t care about it, the added value that I bring them is the fact that I pilot by myself, on Vekia solution. When I say piloting, I mean in terms of data but also in terms of computer processing. And the fact that I have my expertise and my rigor of industrial manager allow me to support them to optimize their stocks and resupplies.
When you set up a new information system or a new ERP with Vekia or another solution, it is clear that the process, the organization and the human aspect is key when talking about this set up. Would you like to add something on this dimension of collective project and organization?
It is true that concerning the tools and IS, there are two philosophies:
There are many companies that will say that the user has to adapt itself to the system, and on the other hand other companies will say that the system has to adapt itself to the user.
For my part, in order to help Mr. Bricolage’s stores, I have made the system powerful, intuitive and the most productive. Personally, I can perform individual configuration in companies’ office packs where Vekia is interfaced.
We have created different processing in stores. Some processing by article that we call “mass change” where the adherents can, depending on different management policies adjust their minimum stock whether by nomenclature, by family, by supplier or even by product. They also can define a default Supply Chain with Vekia’s solution if they feel like they are a bit lost in their choice. We have to tell them what can the solution do, and also give them the ways and process for them to indirectly be able to have the control on the tool functioning.
Of course, I do have some piloting and monitoring indicators that notify or alert me if a management policy is not judicious regarding the store functioning.
Also, the fact that stores, on every order proposal line and for every product have their current and projected stock coverage, it is the data with more added value of the tool.
People in stores usually think that there are some products that represent good sales and some others less sales and wonder why there are not more products ordered to answer the customer demand. Also, in stores we are a lot focused on stockout.
With this Vekia’s tool I realized that there are “good stockout” and there are especially products that are not in stockout but that are in potential disruption of supplies because we don’t have enough stock to hedge future sales that we are going to realize. There is 90% of chance that we realize the sales that the tool predicted.
The tool is able to tell us that there is no interest in buying a certain product (that might be expensive to store) now, it will tell us that we should buy it in 5 months in a half instead.
When we tell this to a retailer, he usually says: ”Julien, I need this product in stock”. But when we project, look forward and we talk to him about his treasury, and that we realize that this product volumetry can represent in certain stores 30% of their stock value.
If they have 1 million € of stock and they apply this 30% of stock value for this product, it represents 300?000 € of their stock. And then we look at the cash-flow problem that is created.
In the end, it is better to optimize your cashflow.
What is important is to consider the cashflow, and explain the importance of the cashflow for the store, and all the optimization of the supply.
I also track the ROI indicator, meaning the return on investments of the stocks. In fact, the minimum of information we need to analyze and make sure we are confronted to a well-managed store is to check that over a 12 months period, it generates a gross margin that is superior to his stock value at every end of the month. Vekia’s tool provided a lot concerning this aspect.
And I realize that to this day, that I have 30% of the stores that I manage, (I manage a total of 200 stores) that generate a margin over a 12 months period that is lower than their stock value.
Let’s visualize an income statement, the first line we read is the turnover, then it is the line of stock value. If we realize that even at this level the store is not profitable and we didn’t even add fixed expenses, wages, taxes and other taxes, we notice that these stores, have a low financing capacity that is negative. So here the profitability is not present at all.
The goal is to have the most powerful ROI, some stores I managed can get an ROI 2 or 3 times higher. For instance, over a 12-month period, a store that has 1 million € of stock will generate 3 million of gross margin. We then know that we have this gap that will allow the store to deduct wages, taxes, fixed expenses. And logically, these stores will have at the bottom of their page a line with a positive self-financing capacity. It means that their activity in a fiscal year is profitable.
If we look ahead in 2025 or 2026, how do see this cloud approach and the mass processing of data?
I tend to say that “we don’t see the end of it”. As we can say, data is great but we have to be able to manage it, and use it the right way. Some data are not useful, it is necessary to choose the right ones, and to work with it in an efficient way.
Managing a volumetry of data represents the need to know that there is a certain number of data that we will not make use of. The data that we will not use represent a cost, because this data is stored on servers. That is why it is important to identify which data is useful for our company in order to keep and save the useful ones.

Adoption of AI in French companies: Managing the emergency!
“Making your Data and AI transformation is something that is becoming normal, something that was not true two years ago.”
The english version replay of our webinar is now available.
Interesting discussions on the place and the adoption of artificial intelligence in french companies today.
Where is france situated compared to other european countries ? Are we too late ? Or in advance ?
It is to those questions and many others that Manuel Davy, CEO at Vekia, Stéphane Roder, CEO of AI Builders, and Alexandre Pinot, Associate Partner at IBM have tried to answer.
All conducted by Fabien Fouissard, Head of Partnerships at Vekia.
French companies, pushed by the covid crisis, seem to have taken the train of artificial intelligence and data, being plunged into a growing digitalized world, boosted by financial aids from a government that also seeks its development.
A real revolution with more and more use cases, or the simple continuity of already existing information systems, artificial intelligence certainly has a great future ahead, in France and around the world.
Discover our expertise articles

Expertise: Automatic Replenishment in Retail
What are we talking about ?
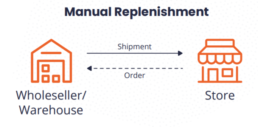
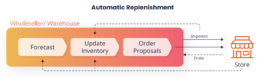
An automatic replenishment system (ARS) primarily generates replenishment orders. The logic of ARS can be embedded into to organization’s ERP systems.
Retailers (supermarkets) generally operate at very high-frequency planning. They usually receive orders every day.
With some retailers dealing with millions of products it becomes highly expensive to monitor the replenishment process manually or with standard ERP systems.
Automatic replenishment planning mitigates this by generating replenishment orders automatically that requires minimal manual intervention.
Benefits
• Lower administrative costs.
• Higher inventory turnover.
• Accurate and flexible reporting.
• Better cash flow.
• Better customer service level and customer satisfaction.
Who benefits from automatic replenishment?
Retailers with:
• Low product availability,
• Laborious manual replenishment planning,
• Excessive replenishment expenses,
• Higher amount of capital locked up as inventory.

Expertise: Promotional Replenishment Planning
What is it ?
Promotions are common nowadays. They generate higher sales volume and higher product varieties.
Challenges remains high though for inventory management. Inaccurate planning can lead to excess inventory at the end of the promotion or dissatisfied customers due to product unavailability.
Promotional planning is vital for retailers to maximize both profit and customer satisfaction.
Promotions can be of broadly two types:
• Stock-clearance (Inventory reduction) or single purchase.
• Regular sales promotion.
While in the first case, replenishment planning is not that important (except where a stock reconciliation is needed), in the latter case retailers must plan for adequate stock to meet customer demand.
Some Practical Aspects
• Response time at the upstream stages for the changes in downstream demand.
• Purchasing from multiple sources :
– Bulk purchase with discounts
– Multi-supplier products
– Outside staging
– Alternate sources inside the supply chain
• Multiple deliveries
Methodology

Expertise : Reducing Inventory at the same service level
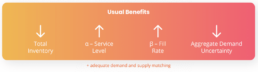
The aim of inventory control is to provide the maximum service level at the least possible cost. Often companies struggle to achieve it by using the same policy for all the products in their portfolio.
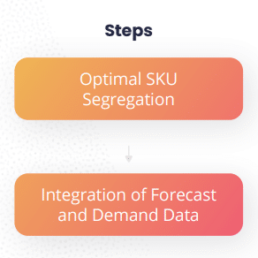
Better forecasting methods, better inventory management methods, and the method to implement them in a segregated way are the keys to achieve higher service levels at a lower cost.
Why do it ?
Especially in customer goods and retail industries, businesses are motivated to spend what ever necessary to maintain high level of service level thereby not loosing customers.
This often results in very high levels of inventory, inefficient production and transportation resulting in unreasonable costs.
Details

Not all SKUs are identical. Therefore, selecting the same replenishment/inventory strategy is not ideal. Following such as unified strategy results in higher expediting, and lower service levels. Both of which are expensive.
While companies do sometimes follow the ABC classification method, a different way of segregating SKUs has been recently explored, i.e. based on Forecastability.


Expertise : Assortment Planning
While most supply chains need this, it is particularly important in retail.
Retailers and FMCG (Fast Moving Consumer Goods) firms continue to expand their product portfolio.
Although this provides customers with more choices from a supply chain management perspective, it poses enormous challenges.
Considering the space constraints, customer preference, and profitability, retailers must decide the assortment plan.

Assortment planning refers to selecting the right product mix at right quantities to adequately match the market demand.
The first dimension is “width” that refers to the number of different product varieties (categories). The second dimension is “depth”, that refers to the different brand options within one particular variety (category).
What changed now ?
With the current situation, retailers must evaluate the questions below :
How to best utilize the existing inventory (at store and in-transit)?
Are there any modifications needed to existing orders?
What is the best plan with the existing inventory that will maximize the profit?
Steps that need to be taken

Keeping a count
of inventory
particularly the
perishable
products.

Lowering the
width (number of
varieties) of
product portfolio.

Using AI to have
the best product
mix and pricing.

Diversifying into
omni-channel
retailing.
Expertise : Inventory Pooling
The need during supply chain disruptions
In a supply chain network, inventory is stored at almost every entity.
Under the current case of decentralized planning, it is often impossible to see the whole network inventory at once. This also can lead to inventory unbalance.
This is true in the case of partially centralized planning as well.
While adopting a fully centralized planning system can be very daunting, “inventory pooling” can help reap some of the benefits of centralized planning without actually adopting it.
Inventory pooling refers to the consolidation of multiple inventory locations into a single one. Inventory locations may be associated with different geographical sites, different products, or different customers.
Inventory pooling differs from centralization (centralized order decisions) where the managers still decide the order quantity for their own store (retail), whereas their inventories are pooled together.
During Supply Chain Disruption
– Inventory pooling is less beneficial than centralization, however, centralization is much more complex, and it cannot be readily implemented in short time. Whereas, inventory pooling strategy can be.
– Inventory pooling increases product availability in comparison to regular planning in case of a disruption.
– It facilitates a more demand-driven replenishment.
– There is also possibility of Virtual Stockpile/Inventory Pooling (VSP) which does not require physical inventory to be accumulated but, provides similar benefits as inventory pooling.

“The last will be first, and the first last”… Insights from the M5-competition
By Johann Robette, Supply Chain Expert @ Vekia
In most supply chains, forecast accuracy rules. Is it also your North Star metric? Then, this article may well change your point of view…
***
In a previous article, I built strong advocacy for a new generation of metrics developed by Vekia that focuses on the business impact of forecasts rather than on their accuracy/precision.
For those who missed this introductory article, here’s the executive summary of “Decision Impact”: 10 reasons to implement the new generation of business-oriented metrics [1].
- The purpose of forecasting is not (and has never been) to provide the best forecast ever! Its purpose is to enable the best decision.
- Yet, existing metrics only measure the intrinsic accuracy of the forecasts. None of them takes into account its actual use and the value it delivers.
- By leveraging a “cost-oriented” digital twin, practitioners could benefit from a family of new metrics that focus on the “Decision Impact” of a forecast.
- This new bunch of so-called “Decision Impact” (DI) metrics opens up new perspectives that benefit not only demand planners but also the whole companies.
This introductory article received great feedback, support and constructive critics from practitioners, academics and software vendors. I really would like to thanks them all!
Almost everyone was eagerly interested in examples of application — what I would call a Proof of Concept (POC). Here we go!
***
This new article is the first of a series that aims at demonstrating the value of such an approach through the lens of a real-world use case.
This series is then an opportunity to look at existing practices from a different perspective. So please, feel free to share, comment and criticize! I always see such engagement as a chance to be less wrong and to improve continuously.
What’s in it for me? [Spoiler alert]
- This article delivers lots of details about the effective implementation of the “Decision Impact” (DI) metrics
- This first use case of DI metrics demonstrates that accuracy metrics lead to the selection of forecasting methods that are absolutely not appropriate from a business perspective. In fact, the “bests” methods could trigger the worst decisions!
The “Walmart” M5-competition dataset as a playground

At Vekia, we leverage the “Decision Impact” metrics for the benefit of our customers in various industries (Telco, Pharma, Retail, Energie, Maintenance, etc.). But as one would easily understand, we do value their privacy and won’t share anything about these contexts (at least without prior authorization).
Let’s then switch to a dataset that is both relevant and publicly available. I’m pretty sure the one we chose will make this series even more insightful!
Among the potential forecast-oriented datasets, one of the most exciting was published in 2020 to support the 5th edition of the Madrikakis competition.
I’m pretty sure you’ve already heard of this worldwide prediction competition organized by the Makridakis Open Forecasting Center (MOFC) and hosted on Kaggle.com. This competition takes his name from Dr Spyros Makridakis, Professor at the University of Nicosia, who has had (and keeps having) an impressive contribution to forecasting practices. If you’d like to know more about the M5-competition, here is the place to learn about it: https://www.kaggle.com/c/m5-forecasting-accuracy
Let’s come back to the dataset.
What’s in this dataset?

This dataset was provided by Walmart, the world’s largest company by revenue, to forecast daily sales for the next 28 days. The data covers ten stores in three US states (California, Texas, and Wisconsin) and includes details about items, departments, categories, and store. In addition, it also contains explanatory variables such as prices, promotions, day of the week, and special events.
With 30,490 product x stores couples, this dataset is a wonderful playground for our experimentation.
The cherry on the cake is: hundreds of forecasters from all around the world have leveraged this dataset to generate the best possible forecasts. The competition being over, MOFC announced the competition results, released the “to-be-predicted” sales, as well as 24 “benchmark” forecasts and the top 50 “submissions”.
So typically, we not only have data describing stores, products and sales… but also 74 forecasts we could leverage to bench test our “Decision Impact” metrics.
In its integrality, this dataset then contains not less than 63 million daily forecasts. Awesome!
10 stores x 3049 products x 28 days x 74 forecasts = 63,175,280 daily forecasts
What’s not in this dataset?
The Madrikakis competition is all about forecasting. Without any surprise then, it does not provide a clue on the decisions those forecasts are intended to support.
But as you know, “Decision Impact” metrics requires considering the decision process that consumes the forecasts. So, we need some additional data to model a realistic replenishment process and a cost function.
Let’s then make some assumptions! If you’re not interested in those details, feel free to jump to the next “Let’s start playing with this dataset” section.
Replenishment strategy
Leadtime
- We don’t have any clue on the lead time required between the creation of a replenishment order and the effective store replenishment. Let’s then assume 3 days are necessary.
- Given orders are trigger on day #1, we’ll only consider demand starting from day #4.
Order cycle
- As you know, retail stores are not replenished only once a month. Order cycles often vary depending on product types, sales velocity, storage capacity, etc. But for the sake of simplicity, let’s opt for a weekly order cycle.
- Our replenishment process then aims at covering one week of sales. Decisions triggered on day #1 cover sales of days #4 to #10. Decisions triggered on day #8 cover sales of days #11 to #17. Decisions triggered on day #15 cover sales of days #18 to #24.
Replenishment policy
- Let’s implement a dynamic (T, S) ‘periodic-review, order-up-to-level’ replenishment policy.
- This policy considers forecasts, initial inventories, safety stocks and pack sizes. As pack sizes allow for different order quantities (depending on the applied rounding function), our policy will assess the economic cost of each scenario (as defined below) to eventually pick up the most profitable one.
Safety stocks
- Let’s configure safety stocks to reach a 95% service level (z-Score 1.65, standard deviation of 2 years of weekly sales history).
Cost function
The cost function is used to score each replenishment decision based on its true business impact. Although costs could be expressed in various units, it’s pretty convenient to express them as a monetary value representing the cost of a given decision.
To evaluate these costs, we’ll again have to enrich the existing dataset and make some assumptions:
Ordering, shipping and handling cost
- Fulfilling an order generates costs for the ordering, preparation, expedition, transportation, etc. These are usually referred to as “fixed costs”. Let’s assume these costs represent $40 per range of $1000 of purchase value.
Holding cost
- Holding costs are associated with the storage of unsold inventories. Let’s assume the annual holding cost is 10% of the inventory value (valued at purchase price), ie. 0.19% per week.
Shortage cost
- When demand exceeds the available inventory, both the demand and customer goodwill may be lost. This cost is usually called shortage cost. As retailers propose a wide range of similar products, a part of the demand is carried other to other products. Let’s assume that only half of the sales will effectively be lost. The shortage cost could then be measured as 50% of each lost sale gross margin.
The total decision cost is then computed as the sum of those 3 elementary costs.
Additional product description
Gross margin
- The dataset provides the sale price of each product, but the gross margin is unknown. As this data is required, the following values are assumed based on Statista.com benchmarks[2] : Foods: 56.77% / Hobbies: 50.37% / Household:43.29%.
Pack sizes
- Obviously, in grocery retail, few products are replenished individually. Yet, pack sizes are not part of this dataset. We’ll then assign a custom pack size to each product, based on a proprietary dataset describing common pack sizes used in grocery retail.

Initial inventory
- When replenishments occur, shelves are hopefully not empty. Obviously, the remaining inventories are still in place and should be accounted for.
- As our replenishment policy aims at guaranteeing a safety stock at the end of a coverage period, let’s take this quantity as an initial inventory.
Let’s start playing with this dataset

Based on the above assumptions, the dataset enables the analysis of 6,860,250 replenishment decisions empowered by 74 different forecast methods. Let’s now see what we could learn from them.
As a first analysis, I propose to focus on computing each method costs and compare them to their accuracy ranks.
If classical forecast accuracy metrics natively promote the best methods, then there’s no need to add new metrics on top of this. But, if it doesn’t, “Decision Impact” metrics make sense…
74 forecast methods
This dataset proposes 74 different forecast methods, composed of 24 “benchmark” methods and the top 50 methods “submitted” by the M5-competitors. Those methods range from the simplest “Naive method” to the most advanced AI-based ones.
Evaluating costs
Each of these methods triggers its own decisions. The previously defined digital twin enables simulating these replenishment decisions and measuring costs.
The results we got show a wide range of costs, ranging from $77.2k to $116.5k! The difference of $39.2k is not anecdotical as it represents not less than 1.4% of the period turnover.
The graph below represents each method and its associated cost. Methods are ordered from the cheapest to the most expensive one.

Here’s the first insight we could get: the cheapest solutions happen to be mostly competitor’s “submissions”. But… not all submissions outperform basic benchmarks, even though they are in the “top 50” methods over 5,507 teams. In fact, more than a third of them (17) perform less than the “F_ESX” benchmark!
M5-competition leaderboard
Let’s now compare those costs to the M5 official leaderboard [3].
The M5 organization scored each method based on a forecast accuracy metric called Weighted Root Mean Squared Scaled Error (WRMSSE) [4].
Update 27/05/2021: as pointed out by Nicolas Vandeput (many thanks), the M5 official leaderboard is built on the average WRMSSE of each method, computed at various levels (from L1 “Global” to L12 “Item x Site”).
The graph below adds each method’s average accuracy rank to the previous display.

Submissions ranks are on average lower than benchmark ranks. But clearly, the competition ranks correlate poorly to business costs. The worst example being Matthias’ method which was ranked second in the competition, whereas it’s the second most costly method from a business perspective after the Naive benchmark.
The competition leaderboard is poorly correlated to costs. This is a fact. But what about other accuracy metrics? Would they be stronger correlated? Let’s assess this!
Other metrics leaderboard
To assess how good other metrics are at capturing business costs, we computed MAPE, wMAPE, sMAPE, MSLE, MAE, MSE, RMSE, WRMSSE, BIAS, NFM (the two last being bias metrics) and their respective methods ranks.
The graphs below display those ranks. The methods are always sorted from the cheapest to the most costly one.

Although most metrics attributes lower ranks to the first half than to the second one, the correlation is far from being good enough from a business perspective. Some poorly performing methods still get assigned crazy low ranks!
Decision Impact metrics
Now let’s put our newly introduced metrics into the testbench.
Our new metrics include DIao, DIno and DIna. DIao measures the financial cost of an erroneous forecast. It then pretty well compares to accuracy metrics.
How is it correlated to costs then? The graph below displays the various methods’ costs and their associated DIao ranks.

By design, Decision Impacts metrics consider costs in their computation. Therefore, with no surprise, DIao metric correlates perfectly with costs.
This metric then performs great at identifying the most appropriate forecasting methods when business matters!
Decision impact leaderboard
Oops… I was about to end this article without sharing the “business” leaderboard! Here it is!
“The last will be first, and the first last”… our congratulations go out to :
- Nodalpoints (Athens, Greece), previously ranked 21
- Hiromitsh Kigure (Japan), previously ranked 45
- leoclement (Paris, France), previously ranked 18
The complete DIao “Business” leaderboard is here including the new DIao ranks and the original M5-competition ranks:

***
This being said, one might still wonder: “Why should we focus on DIao (which requires the simulation of actual and oracle decision costs) while Forecast Decision Cost could be a simpler and most straightforward metric?”
The short answer is: “Because DI metrics enable way more uses than Forecast Decision Cost.”
We’ll go through each of them in the next articles of this series.
***
This article aims to shed light on current practices, limitations and possible improvements. It’s for sure not perfect and suffers from limits.
If you found this to be insightful, please share, comment and clap… But also, feel free to challenge and criticize. Contact me if you want to discuss this further!
In all cases, stay tuned for the next articles! In the meantime, visit our website www.vekia.fr to know more about our expertise and experience in delivering high value to Supply Chain.
Linkedin: www.linkedin.com/in/johann-robette/
Web: www.vekia.fr

Interview with Gregory Debuchy, Supply Chain director at Ferrero France.
“There is a lack of modernity in supply chain tools”

Ferrero France’s Supply Chain counts 170 people, represent €1.4 Bn of turnover and around 800?000 pallets of chocolate Nutella or Kinder per year…
We wanted to meet Gregory Debuchy, Supply Chain France director, in order to understand how he faced up the health crisis.
What has been THE biggest challenge you have faced from the start of the health crisis?
Without any doubt the communication with the clients and the factories. There is a large AG performance opinion poll going on permanently around the 25 biggest suppliers, with 8 recurring subjects, including two subjects on the supply chain: the customer service and the supply chain itself.
We are fundamentally organized in order to be reactive to our clients’ demands and it is thanks to this DNA that we have got the two first places in this ranking.
Our Supply Chain prove to be the most resilient compared to the others for two reasons:
- Our customer service which has for mission to find solutions, to propose substitutions, etc.
- The set-up of a War Room: 3 hours daily sessions, where we think about the worst case-scenario and then where we develop fitting answers.
What did this crisis change for you? How to adapt to the post-covid world?
For the suppliers, purchasing practices came back to normal. However, for our part, we are still under sanitary constraints with a disturbed level of production (social distancing, limited on site access, teleworking…) at the production level but also in the logistics teams.
The return to normalcy, we predict it to happen around the month of September 2021. Obviously, it will not be like before. We will evaluate and measure if consumption behaviors that have changed significantly from the start of the health crisis, regain their natural tendency: we have for instance noticed -45% of sales on Tic Tac and +45% on Nutella. It is not easy to adapt the production and factories.
In the same vein, we also notice a channel consumption change: restaurants are closed and we therefore notice an increase of the consumption in department stores and via drive through.
E-commerce growth in France is still minor but in some countries such as China for instance it is blowing up.

How do you see Supply Chain progress in the coming years?
I think that many companies will ask themselves about their S&OP process in in the coming years.
I have the access to the ILEC (federation that gathers the top 30 of manufacturer of national brands) service rate benchmark and I evaluated a degraded situation in the global industry. At the toughest time of this crisis, Ferrero fell to 92% of OTIF but compared to other brands, it remains honorable. Other brands were at 85% in March, April and May. Ever since we went up to 98% by keeping our advance.
I think that every FMCG companies will have to reorganize their safety stock, their BCP (Business continuity plan) and reworked their S&OP process. Moreover, I have started an assessment of our internal S&OP process at Ferrero.
Beyond the crisis, we have to go one step further: we know how to plan the cannibalization of similar products of our internal assortment. Next step: to capture these external factors for competing brands.
Which tools does the Supply Chain need the most?
I would say that IBP (Integrated Business Planning) tools are very complicated tools that teams hardly master. A simplification of these tools would be great.
There is still some deficiency: sometimes when we change a setting and we don’t control the result that comes out. There is no clear correlation between the results.
Which innovation would you advise to your counterparts to closely monitor?
I would probably advise them to be interested in logistics business of picking robotics, or in inventory drones for instance… It gives a modern image to attract talents.
What would you ask to innovators to create as invention?
I would like them to be able to predict to the nearest unit what we are going to sell tomorrow! We have a research department at Ferrero which spent a fortune at a big consulting firm to hear that the consumption in the next 3 years would progress from +5% to -5%… I think that our profession deserves more in terms of study and of quality of forecast !